

Check out this interesting analysis for you to understand exactly how the real estate market is, not how people seem to put "spins" on it!
As you can see on our latest visualization of Toronto Real Estate Board Statistics, GTA market seems kind of strange. It seems that there are typical signs of market slow-down:
- More houses are available
- Houses take longer to sell
- Sales have declined
However, when you look at the average price - it is still going up! Sales down, average price up - is this a strange market? Well, there is an explanation.

October housing stats in GTA
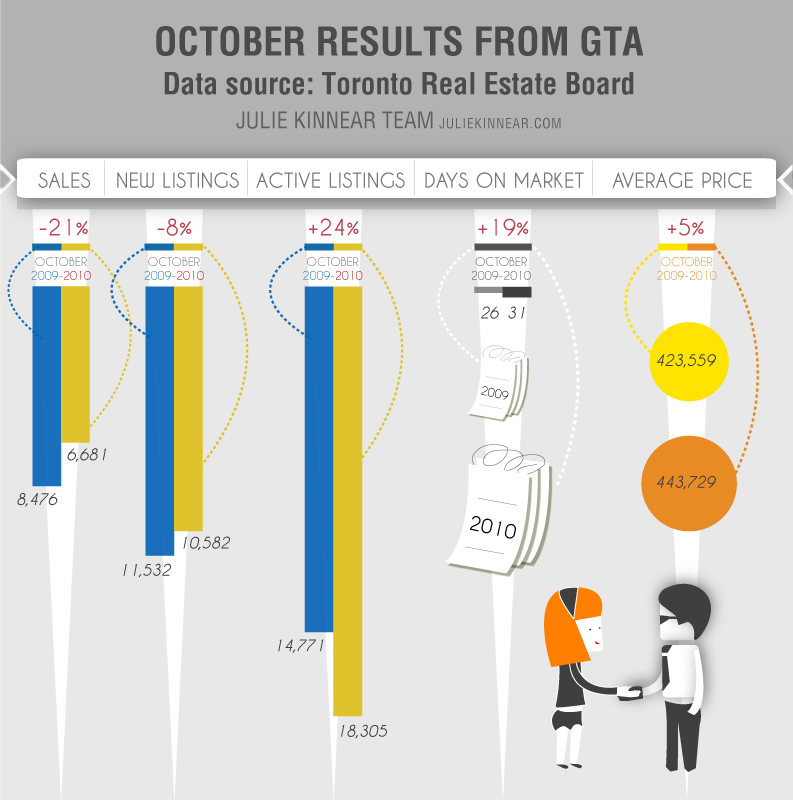
The explanation reveals itself when you look at the long term sales figures. See the October sales results since 2004:
| 2004 | 2005 | 2006 | 2007 | 2008 | 2009 | 2010 |
|---|---|---|---|---|---|---|
| 6,666 | 7,174 | 6,876 | 7,915 | 5,155 | 8,476 | 6,681 |
As you can notice, except the very strong October in 2009, this October results do not divert from the usual number of sales. Similarly, have a look at the year-to-date results for the first ten months since 2004
| 2004 | 2005 | 2006 | 2007 | 2008 | 2009 | 2010 |
|---|---|---|---|---|---|---|
| 73,202 | 73,514 | 72,639 | 81,563 | 68,570 | 74,721 | 75,582 |
Here the trend is even more obvious. This year, sales in GTA MLS area are even slightly higher than in 2009.
While in 2009 sales were catching up the recession loss, this year the situation was turned heels over head. Spring sales were boosted by the upcoming interest rate hike and HST introduction, and ate a large portion of autumn sales. However, the average number of sales remain the same and so does the average price growth. The usual real (inflation adjusted) average price growth for the last two decades is around 3%, thats near where are we today.