Recently Listed:
321 Ontario Street
Central Toronto - Cabbagetown
$1,795,000
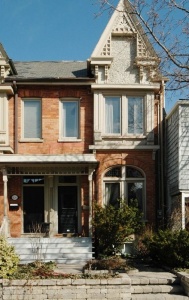
Spectacular restored/renovated/remodelled Victorian in Cabbagetown!
Wow! Must See!! Professionally designed, serene, and extremely bright space combines original character with modern, high-end luxury finishes. Big beautiful private rear yard, gardens & bonus double covered parking. A special home to enjoy, entertain and relax in.
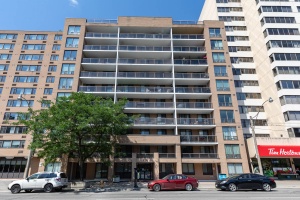
250 Jarvis Street #905
Central Toronto - Cabbagetown
$499,900
250 Jarvis Street #905 is a 2 bedroom condo in a well-run boutique building located in the Yonge-Church corridor. With a WalkScore of 94/100, the city is "yours to discover" on foot!
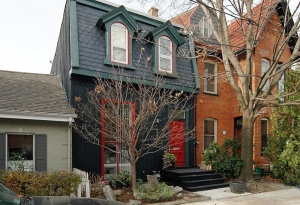
322 Berkeley Street
Central Toronto - Cabbagetown
$1,449,900
This absolutely stunning renovated 1890's Victorian is situated on a quiet and pretty tree-lined one-way street, easy walk to all the shops, parks, schools and more.
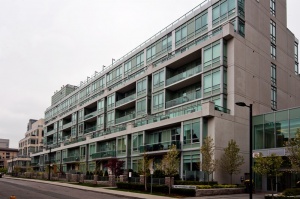
120 Homewood Avenue #217
Central Toronto - Cabbagetown
Spectacular 1140 sf LOFT @ The Verve!
Made for entertaining! Rare preferred one level style with soaring ceilings and exceptional layout. Sophisticated 2 bedroom + den, 2 bath in the luxurious Tridel-built true "Green" building of Condos & Lofts! Definite WOW factor for all your family & friends that visit!
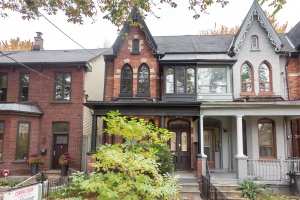
248 Ontario Street
Central Toronto - Cabbagetown
Cabbagetown Cool! Fab 116 year old detached heritage home in hip South Cabbagetown neighbourhood has curb appeal galore! New England style exterior combines with bright open concept interior to offer 2000+ s.f. of cool architecturally designed living space.
428 Wellesley Street East
Central Toronto - Cabbagetown
This gorgeous historically designated Victorian blends restored original charm with the latest in quality modern upgrades.
CABBAGETOWN's history began in the 1840's when thousands of Irish immigrants settled here after fleeing the potato famine in their homeland. To put food on the table they grew cabbages on their front lawns, which is how this district came to be known as Cabbagetown. The neighbourhood flag, a green cabbage on a white background, can be seen flying, usually bestowed on a home or shop owner for architectural or design excellence.
Cabbagetown was revitalized in the 1970's and 1980's by new home buyers, who restored much of the neighbourhood's fine collection of Victorian homes. Cabbagetown is now considered one of Toronto's most gentrified and popular neighbourhoods. Its residents come from a wide variety of backgrounds, however they all share a strong sense of community spirit and pride in their neighbourhood, which is evident during such events as the Cabbagetown Fall Festival that runs for an entire week in September and features a parade, concerts, a film festival, a great dog show, community-wide yard sale and tours of the area's fabulous homes.
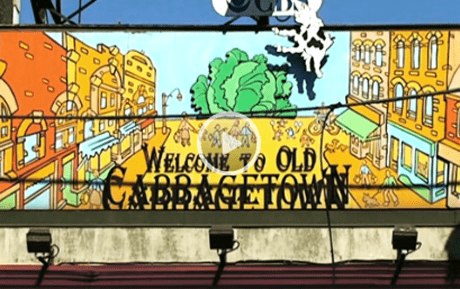
Check out this amazing photo essay by photographer George Peters
Cabbagetown's public schools include:
- Winchester Jr. & Sr. School
- Sprucecourt Jr. School
- Lord Dufferin Jr. & Sr. School
- Rose Ave. Jr. School
- Regent Park/Duke of York Jr. School
- Nelson Mandela Park Jr. & Sr. School
- Jarvis Collegiate Institute
- Eastdale Collegiate Institute
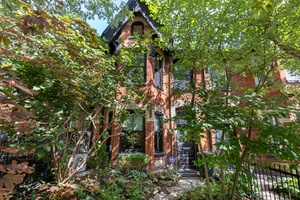
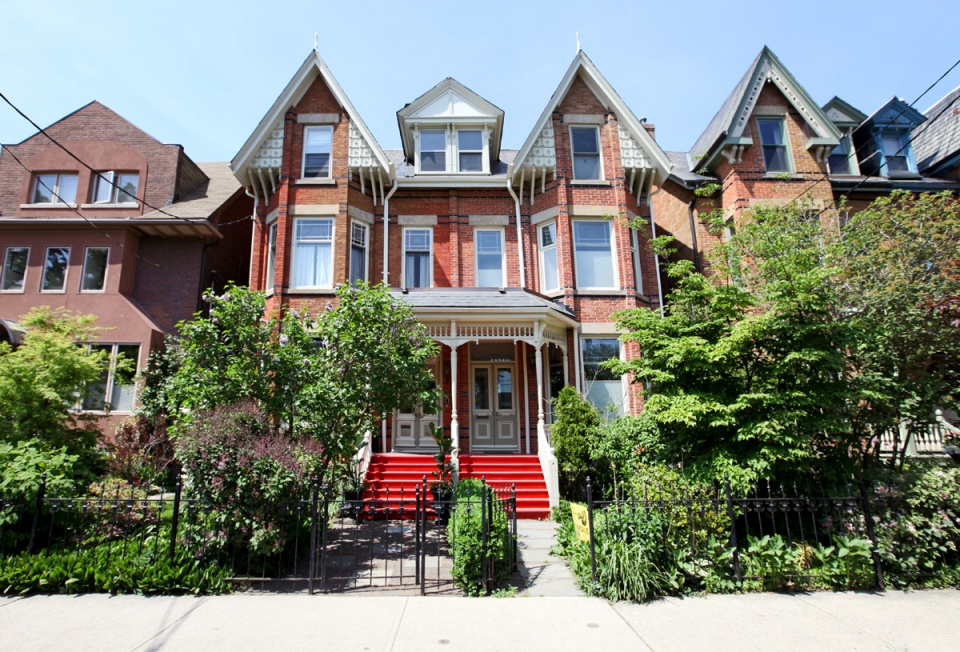
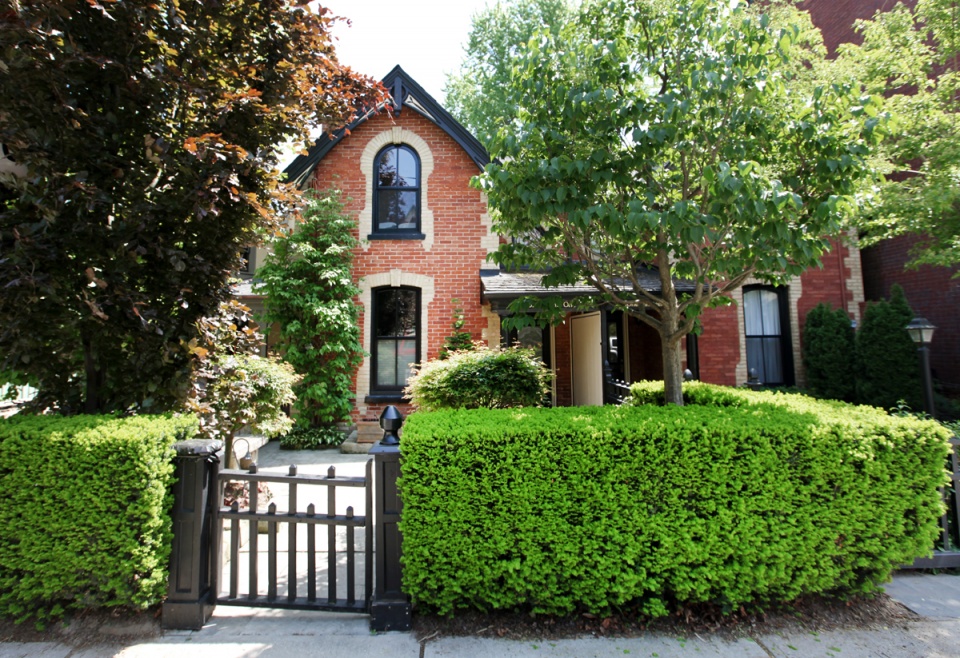
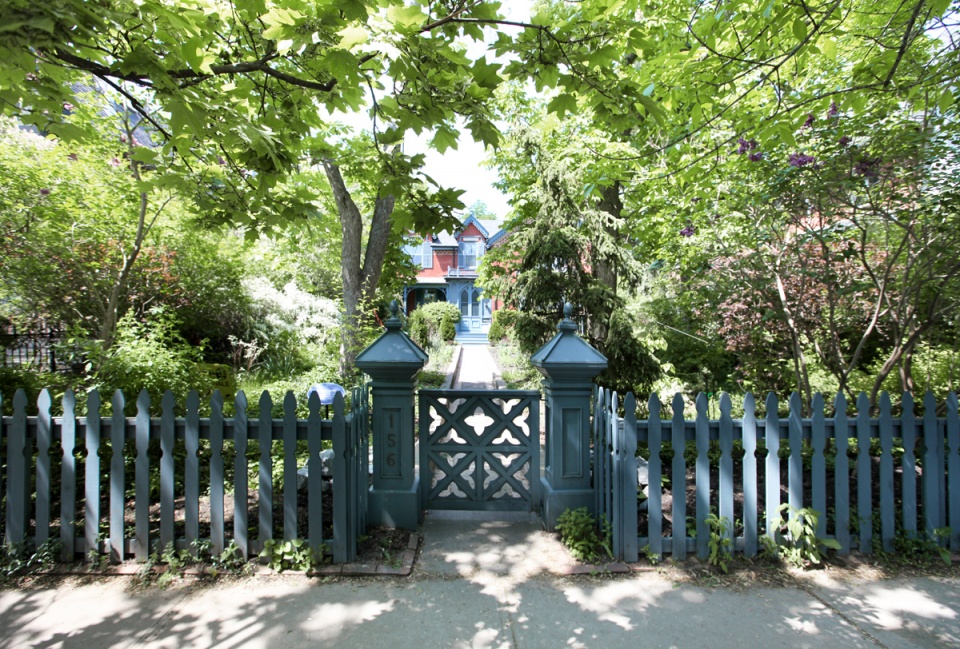
The Cabbagetown neighbourhood was once described by the New York Times as "containing the largest collection of Victorian homes in North America". Cabbagetown's houses were built between 1860 and 1895. Most of them have been lovingly restored to their original beauty, with delicate iron fencing, carefully manicured lawns and fragrant gardens, and whimsical architectural detailing, under the watchful eye of the Cabbagetown Preservation Association. Made up of local residents, the Association helps ensure that all Cabbagetown renovations and new developments are in keeping with this historical neighbourhood.

Cabbagetown Victorian Houses
Cabbagetown Trimmed Gardens
The 'Old Cabbagetown' shopping district on Parliament Street features many one-of-a-kind shops and a vast array of restaurants. Examples of great shops: Posterity Graphics at 523 Parliament, and Mi Casa (238 Carlton, close to Parliament). Experience fine food at Daniel et Daniel on Carlton, kick back at the Ben Wicks pub on Parliament. The Phoenix Concert Theatre, everyone from the Rolling Stones to the BareNaked Ladies have performed here. New bands and mega starts all perform! The Carlton Street shopping district is similar in tone to Parliament Street, but on a smaller scale. Cabbagetown also has retail pockets on Gerrard Street, Sherbourne Street, and Wellesley Street East, and Yorkville is within walking distance.
Cabbagetown's recreational centre is Riverdale Park, at the corner of Winchester and Sumach. This park is the home of Riverdale Farm, once the site of Toronto's first zoo and now an actual working farm in the heart of the city used to expose city children to agricultural concepts and experiences. The Farm offers pathways through wooded areas, ponds, and butterfly-herb-vegetable-flower gardens. Cows, horses, donkey, sheep, goats, pigs, chickens, turkeys, ducks, geese, rabbits, and cats may be seen along the way in barns and outdoor paddocks. As well as demonstrations of daily chores including animal feedings, egg collection, cow milking, goat milking, and horse grooming, there are also many annual events, day camps, programs for toddlers & children. Riverdale Park also contains sports fields and serves as an access point to the Lower Don Recreation Trail.
The Riverdale Farm
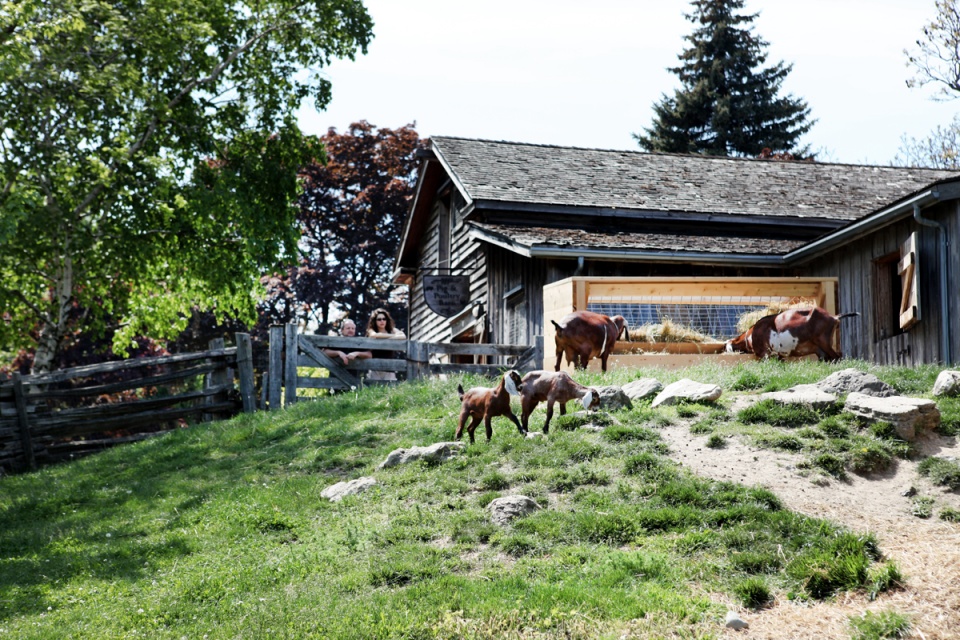
Riverdale Animal Farm

The Cabbagetown Community Arts Centre at 454 Parliament Street has music, drama and dance programs for children. The Cabbagetown Youth Centre at 2 Lancaster Avenue offers sports, and arts and crafts programs. Additional community centres serving the area include:
- Central Neighbourhood House, 349 Ontario St.
- Dixon Hall, 58 Sumach St.
Cabbagetown's Public Library is located at the corner of Gerrard Street and Parliament.
Allan Gardens, at the corner of Carlton & Jarvis, offers outdoor gardens, greenhouses and a glassed-in botanical garden providing a tranquil setting year round in which wedding photographs are commonly staged. It is especially lovely over the Christmas holidays, when the tropical gardens feature a holiday flower show.
Cabbagetown Garden
Other nearby green spaces include:
- David A. Balfour Park
- Todmorden Mills Park
The Sherbourne bus and Parliament streetcar connect passengers to stations on the Bloor-Danforth subway line. The Wellesley bus and Carlton streetcar connect commuters to the Yonge-University-Spadina subway line. For motorists, the Don Valley Parkway is approximately five minutes away, while Toronto's downtown business and entertainment districts are less than ten minutes from Cabbagetown.
Cabbagetown is located close to Toronto's Gay Village centred around the intersection of Church & Wellesley Streets, which is home to Canada's largest gay community and offers a full slate of entertaining things to see and do year-round. The area is packed with cafes, restaurants, gay-oriented shops and a vast array of bars and hot nightspots that cater to an irresistibly seductive mosaic of orientations, cultures, ages, shapes and sizes. Toronto filmed Showtime's series Queer as Folk in the Village.