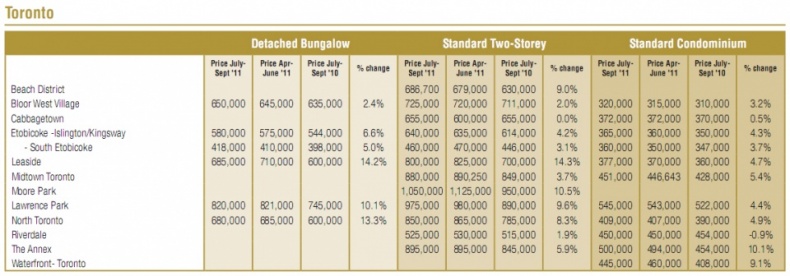
Complete Data Chart
for Toronto
According to a newly released The Royal LePage House Price Survey, the average price of a house in Canada rose between 5.7 and 7.8 per cent in the third quarter of this year, compared to the same period a year ago. The healthy gains come as a surprise, but show that the consumer confidence of Canadian buyers remains high. On the other hand, the results may appear a bit deceptive in comparison to crisis-struck 2010.
Phil Soper, president and chief executive of Royal LePage Real Estate Services, commented on the data: "The third quarter saw a return to a normal seasonal business cycle as price appreciation slowed in many areas – with some average values even falling slightly – after the busy spring trading season. A broader slowdown is expected in the months ahead but fears of a US-style correction are completely unfounded."
Detached bungalows saw the most rapid price increase, as they rose 0.8 per cent year-over-year to $349,974 in the third quarter of 2011. Standard two-storey homes went up by 7.7 per cent to $388,218, and standard condominiums rose 5.7 per cent to $239,300.
Foreign investors' demand played a substantial role in driving the prices up in the largest markets, such as Vancouver and Toronto. Conversely, some areas experienced mild decreases: detached bungalows in Calgary fell 1.0 per cent, and detached bungalows and standard two-storey homes in Victoria fell 2.0 and 1.1 per cent, respectively.

Complete Data Chart
for Greater Toronto Area
In general, the data show that Canadian citizens don't seem to be too worried about the economic turmoil in the European Union and the United States and trust the strength and stability of the domestic markets. "A resilient domestic economy coupled with the stimulative effect of ultra low interest rates has extended the post-recession bounce in house prices, but there is evidence of over-shooting in some markets. Although some commentators are predicting that the sky will fall on the Canadian housing market in a US-style implosion, we lack the structural conditions that precipitated the housing crash in the United States six years ago," said Soper.
Regional Market Summaries
Saint John and Halifax both witnessed a 10.4 per cent increase with standard condominiums. Other markets in Atlantic Canada remained stable year-over-year. This can be explained by sales of higher-end waterfront listings.
Montreal showed considerable year-to-year increases of standard two-storey homes – the average price rose 4.4 per cent to $367,500. Standard condominiums rose 7.6 per cent to $236,333.
In Ottawa, all three housing types included in the survey rose 7 to 8.4 per cent.
An impressive increase occurred in Toronto, as prices rocketed across all three housing types surveyed by up to 9.4 per cent. The developments are largely considered to be a consequence of a lack of supply. The lowest increase was experienced by standard condominiums as they 'only' rose by a modest 6.0 per cent.
Healthy price gains were experienced in Winnipeg as well. Analysts agree that the increase is largely caused by population growth. Standard condominiums rose 6.4 per cent, detached bungalows went up by 5.1 per cent, and standard two-storey homes increased 4.4 per cent.
Both the Calgary and Edmonton markets remained relatively stable, and the eventual gains are kept within the 4 per cent border in year-over-year comparison.
Out of all the areas, Vancouver data showed the most dramatic increases. Detached bungalows rose by an unbelievable 17.0 per cent, and standard two-storey homes increased 16.9 per cent. Condominiums in the city went up by a healthy 5.1 per cent as a result of higher inventory.
Royal LePage's quarterly House Price Survey shows the year-to-year change of prices for the main housing segments in select national markets. It is the largest survey in the field in Canada, providing information on several types of housing all around the country. The release tries to highlight the most important trends and developments on the market using the abbreviated version of the survey as a source.
All graphs courtesy of Royal LePage


